Your pipes / Age and pace
How old are the water mains under your street?
of water mains more than 50 years old in 2025
WSSC Water pipe age is published as a share, not an average: about 42% of water mains were more than 50 years old in 2025, up from about 40% in 2021.
By the Your Water Numbers desk, not WSSC Water · Updated · How we check
Look up your number: the replacement pace
| Pipe group | FY27 pace | Years to pass all | Note |
|---|---|---|---|
| All 6,000 miles, budget book | 32 miles | About 188 | Our arithmetic |
| All 6,000 miles, adopted CIP | 35 miles | About 171 | Our arithmetic |
| About 1,031 large miles | 5 miles | About 206 | Our arithmetic; own program |
Source: WSSC Water FY27 budget book and adopted CIP · FY27
Reading this: Read this as a speed, not a schedule. Not all pipe needs replacing, and the first two rows divide the whole network by miles that mostly go to smaller mains.
Is there an average age for the mains?
No average is published in what we could read, so we won’t state one. The share is the number available: about 42% over 50 years in 2025, about 40% in 2021.
Age alone does not tell you what is under your street. The older pipes are cast iron or asbestos cement, and we found no street-by-street age list. Mains also come in many sizes, from 3 to 96 inches.
Remainder, our arithmetic
Source: WSSC Water aging-pipe FAQ · 2025
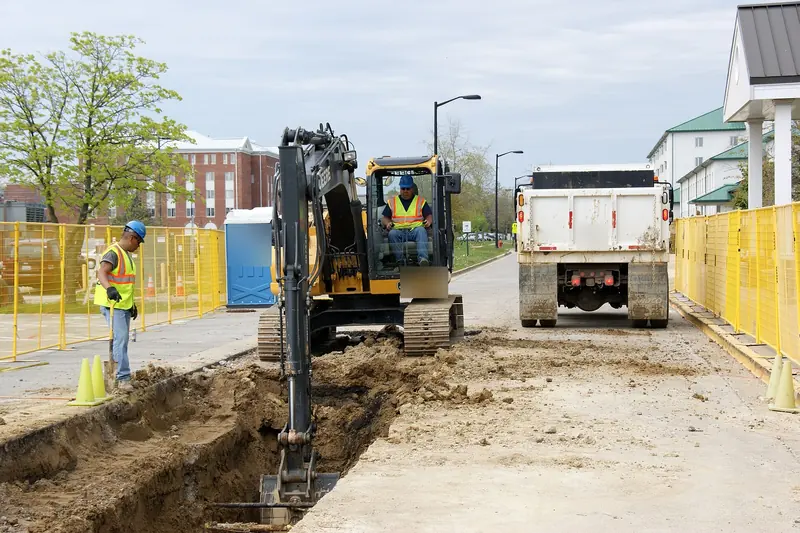
How fast is the pipe being replaced?
32 miles or 35 miles in FY27, and both figures are official. The budget book says $68 million of Water Reconstruction buys 32 miles. The adopted CIP says 35. The budget also names 32 miles a year as its goal for smaller mains.
Large mains run separately. FY27 puts $58 million toward 5 miles of pipe over 16 inches.
Source: Our arithmetic from WSSC Water figures · FY27
What does a mile of main cost?
About $1.9 million to $2.1 million in FY27 for the reconstruction program, our arithmetic: $68 million divided by 35 miles or 32 miles. An older utility page gave an average of $1.4 million per mile, so treat that one as dated.
Big pipe costs far more. $58 million over 5 miles comes to $11.6 million a mile, our arithmetic. These are budget lines divided by miles, not contract prices.
How much pipe is there to look after?
Nearly 6,000 miles of water main, across a 1,000-square-mile area. Sewer adds 5,700 miles more in the adopted CIP. Together they serve 1.9 million customers.
Some large pipe is watched rather than dug up. Acoustic fiber-optic monitoring covers more than 110 miles of prestressed concrete cylinder pipe, with a goal of replacing up to 2 miles a year.
Where does an old main show up on your bill?
In a fixed line, not a usage charge. The Infrastructure Investment Fee pays toward the borrowing behind pipe reconstruction, and larger meters pay more.
Old mains also show up in the winter count. See breaks by month for the 2,259 logged in FY25.
Does an old main change what you should do at home?
Not much. The main is the utility’s, up to the property line. Your part starts there, and that is where your money and attention go. Who owns which pipe has the split.
Use the 42% this way
- Don’t try to work out your street’s main age from your house’s age
- Know your house valve for when a main near you breaks
- Check the Infrastructure Investment Fee line against your meter size
- Leave the street pipe and street valves to the utility’s crews
Questions on this page
Why do two official documents give different mileage?
The FY27 budget book says 32 miles and the adopted CIP says 35 for the same $68 million line. We cite both because neither page we read explains the gap.
Will every main really take 171 years to replace?
No. That is 6,000 divided by 35, a way to compare pace, and it ignores that not all pipe needs replacing.
Can I find the age of the main on my own street?
We found no address-level list and no published average. WSSC Water is the one to ask.
Where each number comes from
| Figure | What it is | Source | As of |
|---|---|---|---|
| About 42%; about 40% | Share of water mains over 50 years, 2025 and 2021 | WSSC Water aging-pipe FAQ | 2025 |
| $68M; 32 miles; goal of 32 miles a year | Water Reconstruction, FY27 | WSSC Water FY27 budget book | FY27 |
| 35 miles; 6,000; 5,700; about 1,031 | Replacement miles and network miles | WSSC Water adopted CIP FY27-32 | Aug 2026 |
| $58M; 5 miles; 110 miles; up to 2 miles | Large-pipe program and monitoring | WSSC Water FY27 budget book | FY27 |
| $1.4 million per mile | Older average replacement figure | WSSC Water older aging-pipe page | older page |
| 171; 188; 206 years, $1.9M to $2.1M, $11.6M, 58% | Pace and per-mile sums | Our arithmetic from WSSC Water figures | FY27 budget lines |